Excess mortality compared to vaccination in the covid era
Here we investigate at the possible association between excess mortality and vaccination rates. One would expect vaccination to decrease overall mortality in a population but sometimes we see the opposite (Figure 1). Especially the booster doses are closely related to increased mortality. Four countries are picked out as case studies, while the remaining countries are plotted in the Appendix. However, not all countries have the same strong association with mortality. This is likely because only 5% of the vaccine batches appear to have produced 90% of the adverse reactions (see also Schmeling et al., 2023). Some Pfizer batches are associated with 30 x the number of deaths and disabilities compared to other batches. Thus, some countries could have received more of the tainted batches.

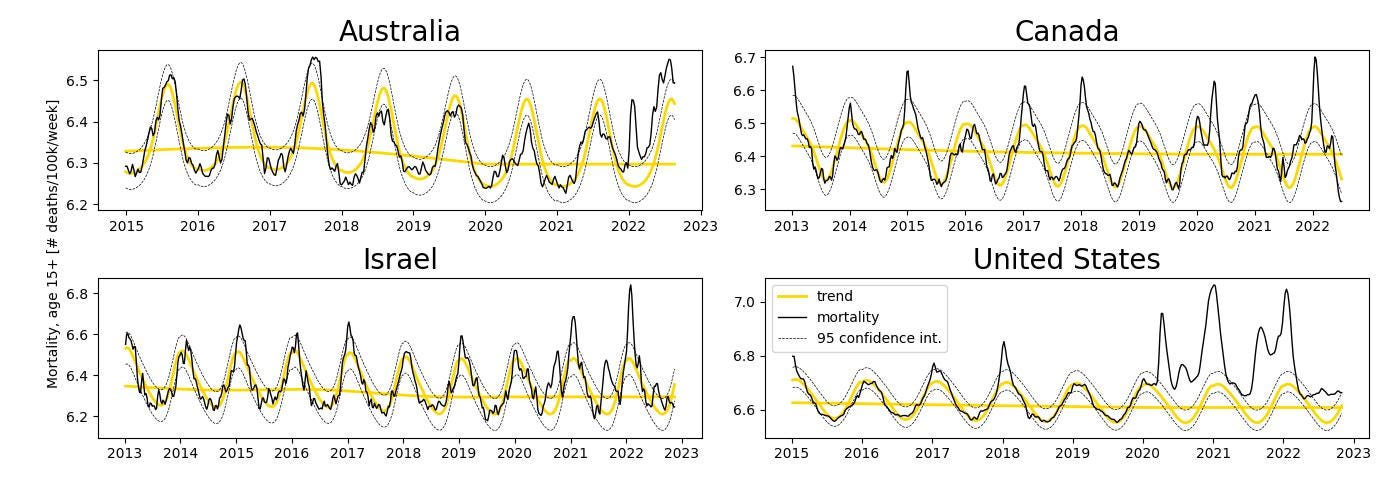
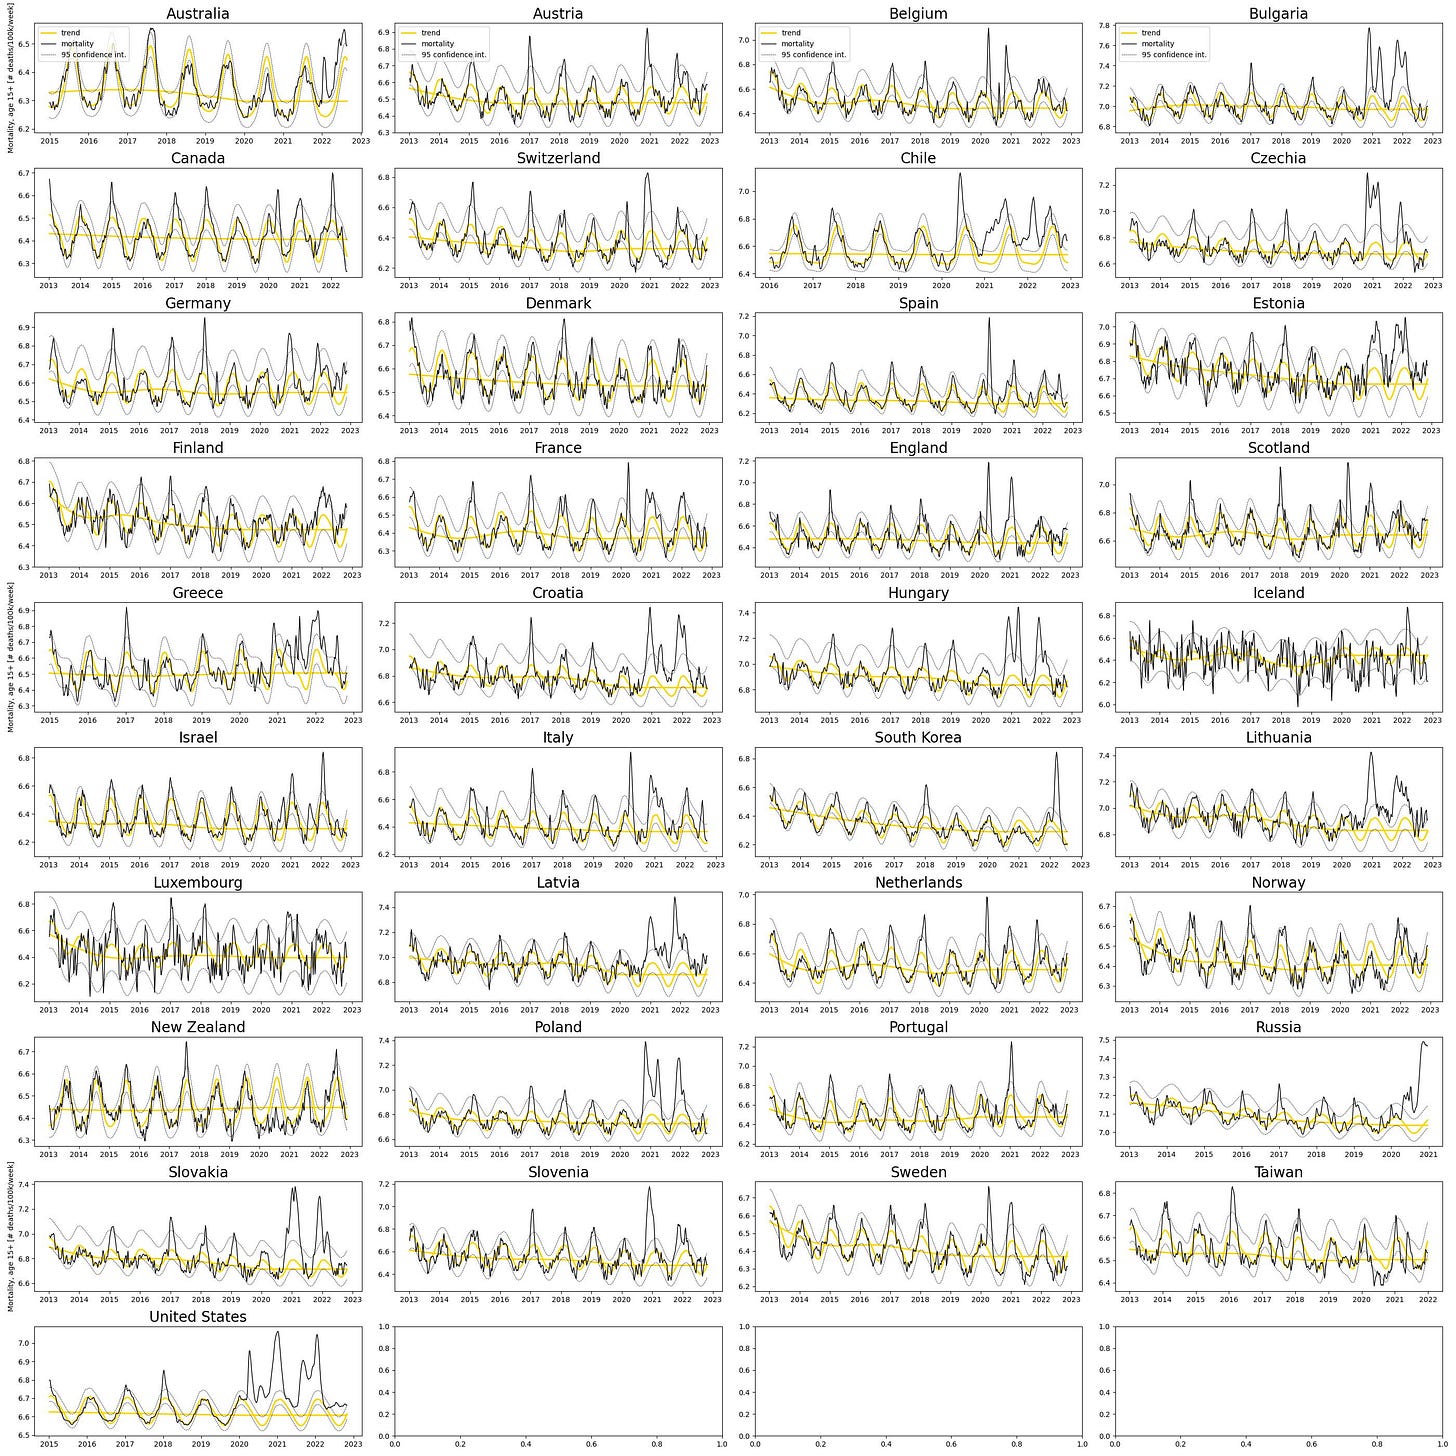
For ease of comparing mortality rates between countries (Figure 2), the data was age-standardized using a 100k standard population and stripped of its seasonal and long-term trends (see Methodology section). In doing this, we see that there are more deaths occurring in winter than summer for countries far from the equator, which this data set contains many of.
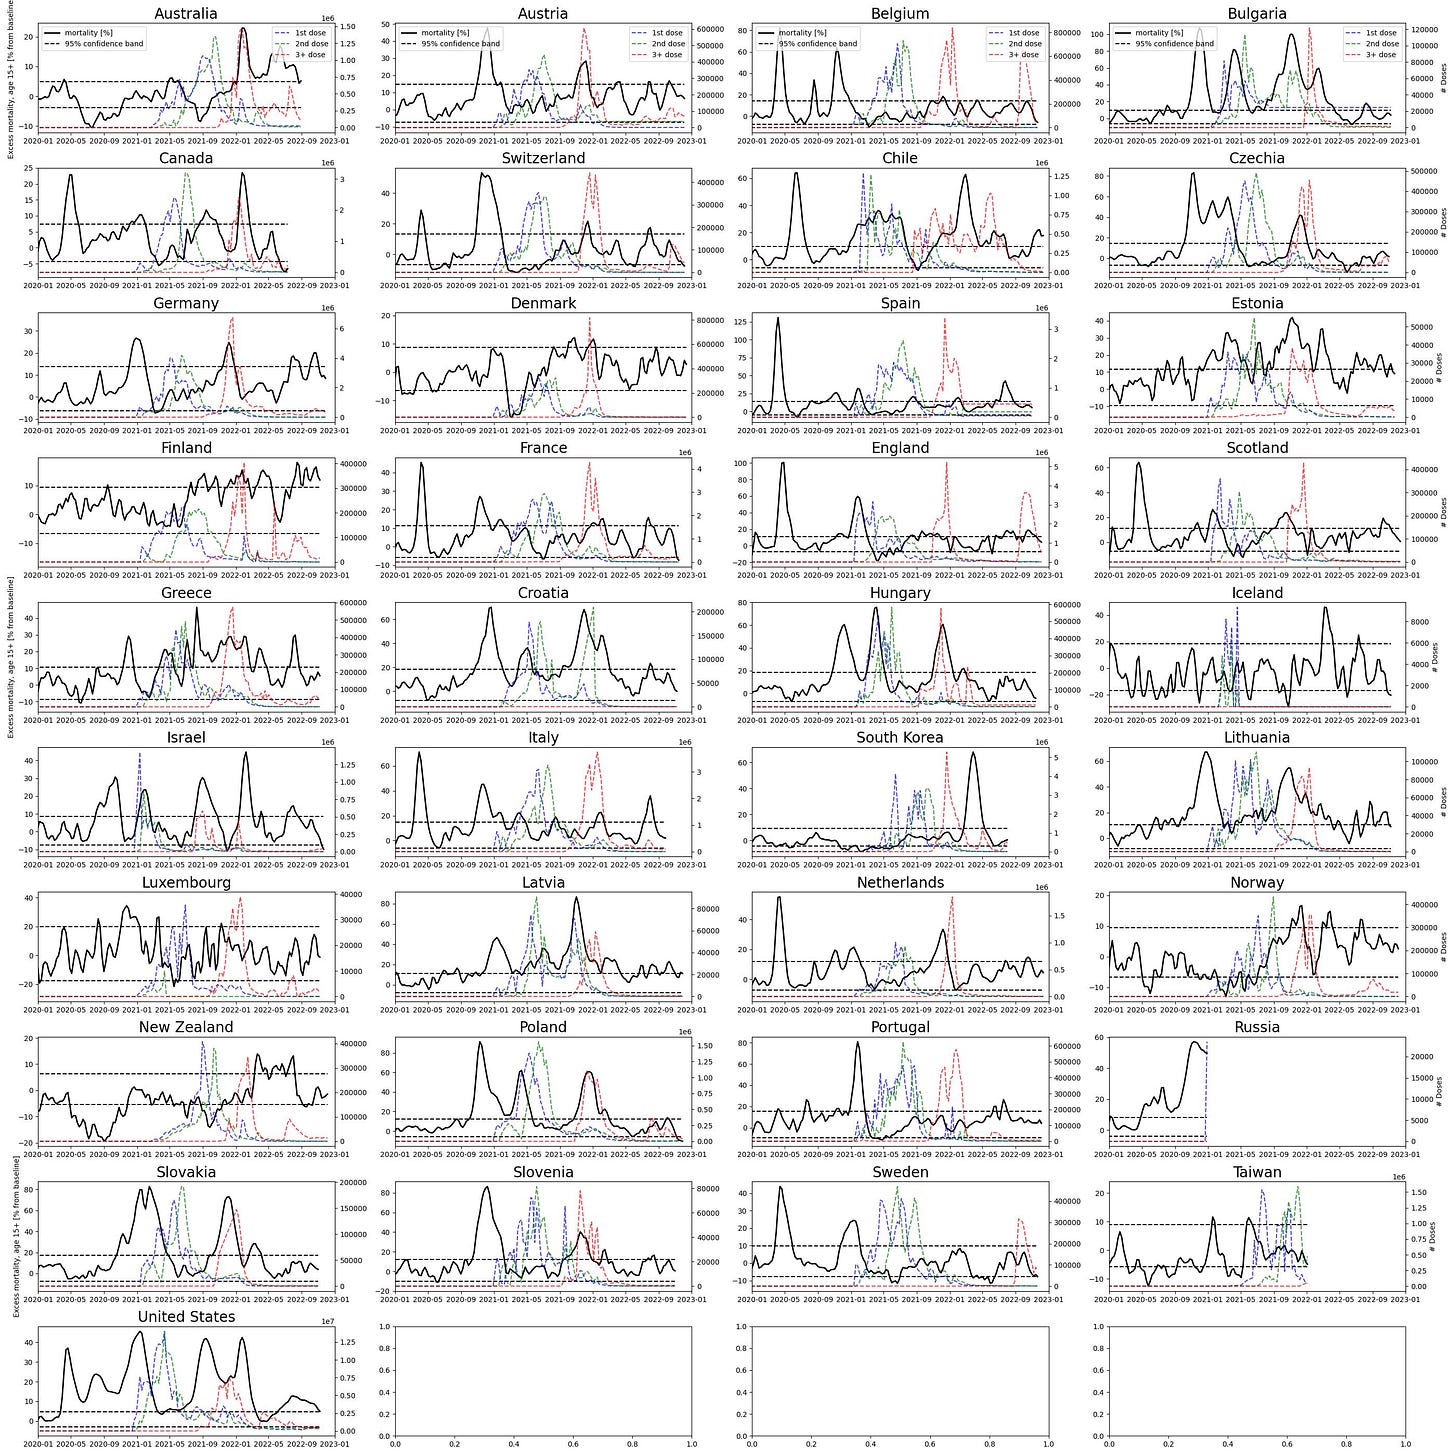
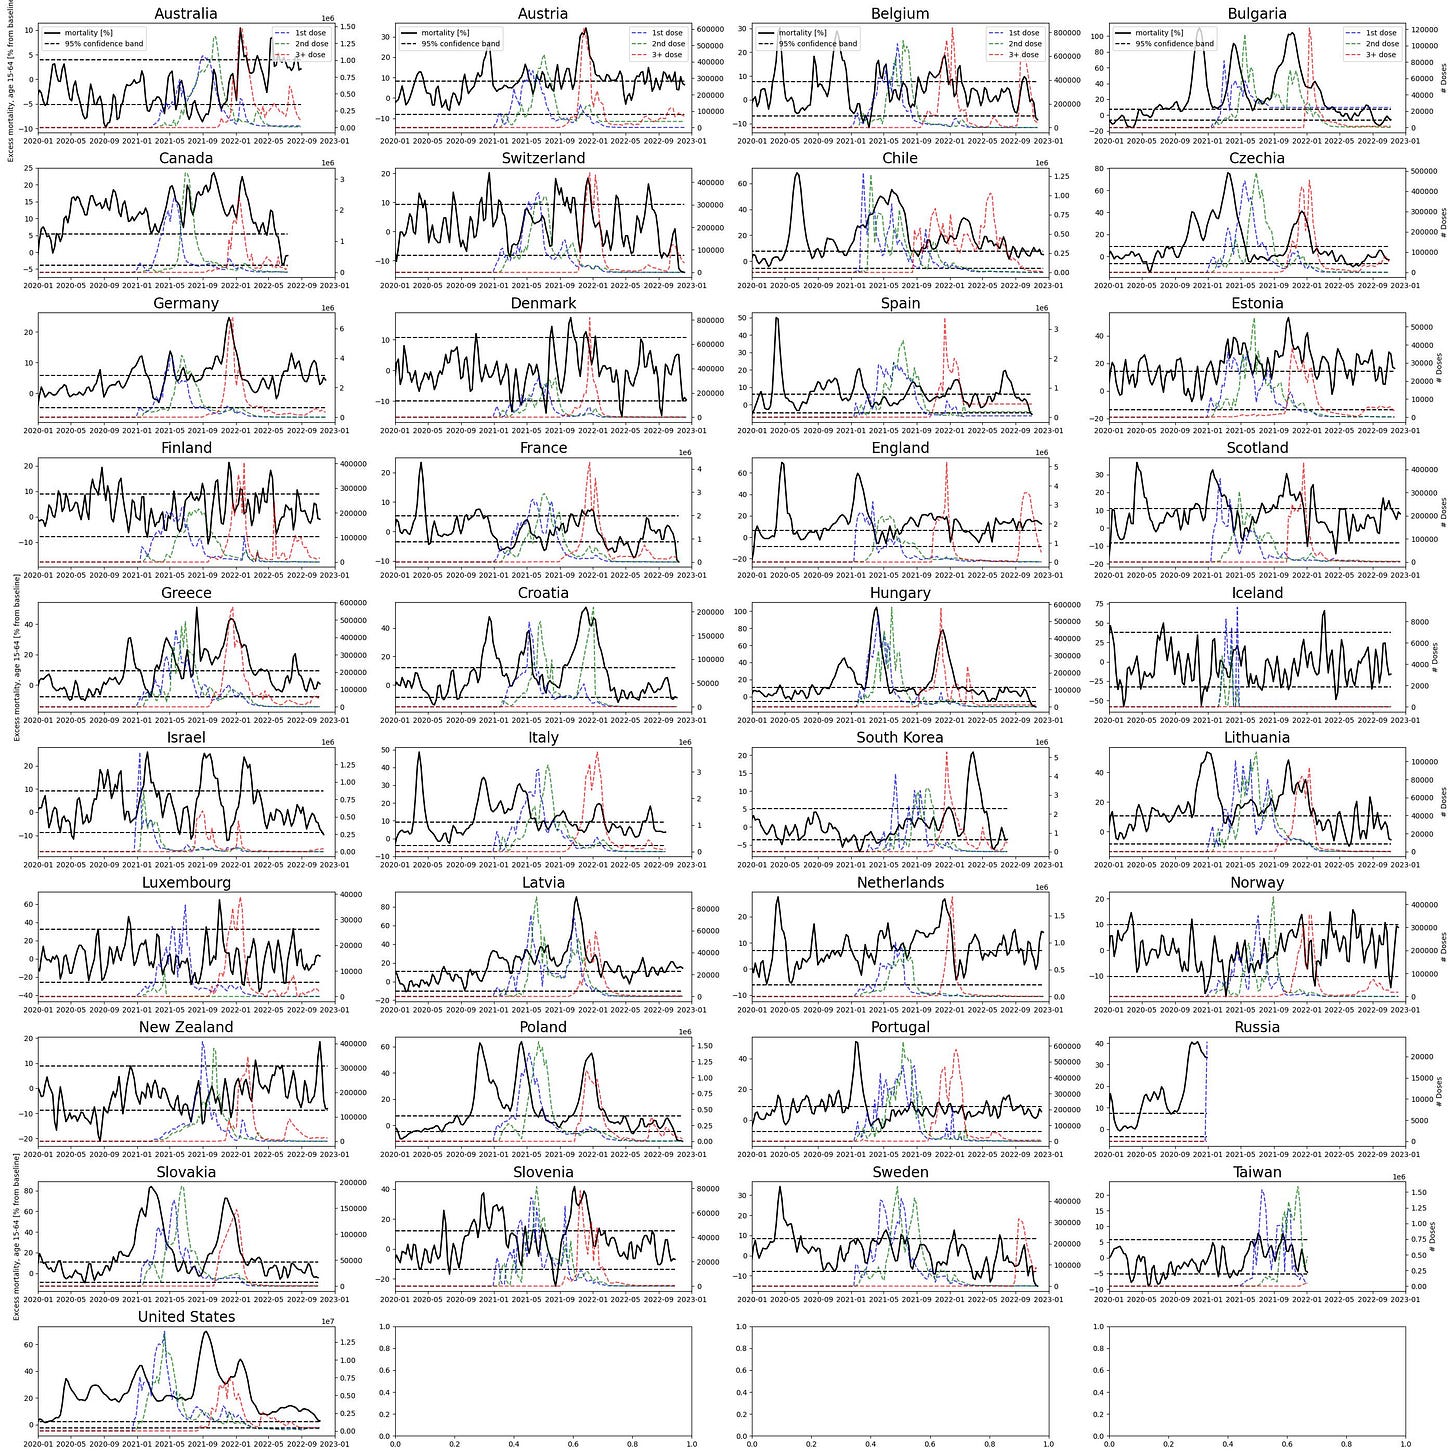
The booster is also more strongly associated with increased all-cause-mortality than the first two doses (see figures in Appendix). This might be due to the memory of the human immune system intensifying the autoimmune (self-to-self) attack caused by spike protein production of our own cells post-vaccination (discussed by Doctors for Covid Ethics, 2022).
It is interesting to note that less than half of the countries analyzed showed anomalous mortality in the initial Covid wave of March-April 2020 (although there is evidence that covid was endemic before 2020, as early as September 2019, according to this Italian study) (see also Elmore et al. 2020).
On Causality
While there is a clear association between vaccination and mortality in these results, the question of causation remains. Bradford Hill argued in 1965 that 9 criteria could be used as guidelines to be followed in pursuing the question of causality. Ioannidis (2015) argued that only 3 of these criteria have been proven to be useful given the literature published since Hill’s paper, these being experiment, temporality, and consistency. Thus, we will focus only on these criteria.
Experiment: The first criteria relates to the emergence of the claimed effect in a controlled experiment. We now have more than 1000 papers with case reports of adverse effects and death induced after the vaccination, fulfilling this criteria by most standards. In some situations, one could divide this criteria into in vitro and in vivo studies, although given the large body of evidence of harm this might seem redundant.
Temporality, or as Hill says: ‘The temporal relationship of the association – which is the cart and which is the horse?’. This criteria is at the core of our study. As we have already established visually but without a formal statistical hypothesis test, there seems to be a temporal relationship between our two variables mortality and vaccination at least in the 4 countries shown above. This claim is supported both by the shapes of the curves and the timing wherein vaccination is followed by excess mortality. In other countries it may seem that the delay between the two is larger (see Norway in Appendix figures). There are many reasons to expect a non-linear relationship between the these two variables though: 1. Different demographics received the vaccine at different times, where older people were generally the first group to receive it. 2. There might be multiple pathways through which the vaccine induces harm. For example, there can be short-term anaphylactic shocks while heart complications manifest over longer time scales. 3. Each pathway to harm can be non-linear in time, with a certain window period of heightened risk. These complications render a formal statistical causality analysis tenuous.
For the statisticians in the audience a linear Granger causality test produces significance at the 1% level for the 4 countries above, and most of the other countries in the data set, but I would not lean heavily on such an argument for the reasons mentioned above. More complicated non-linear tests exist but are outside the scope of this analysis. For further discussions on pitfalls of Granger causality see G. Grassmann (2020).
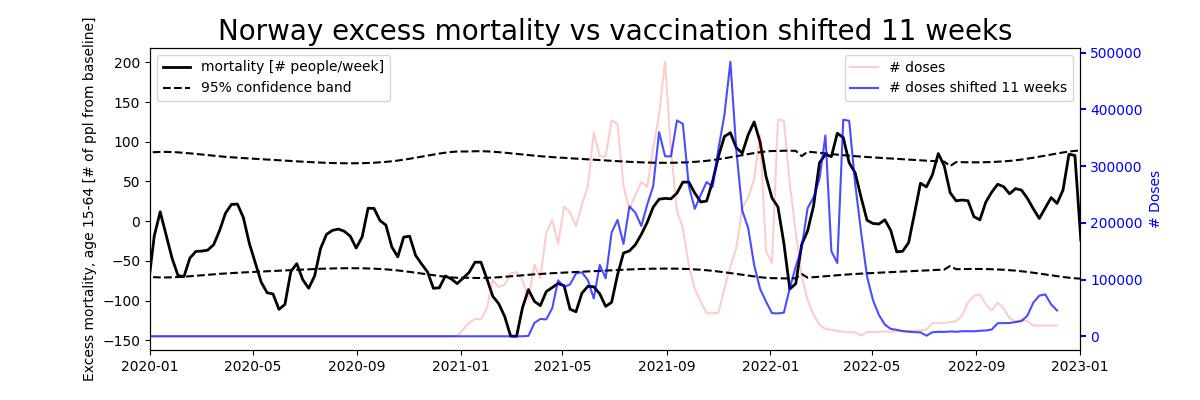
One point worth noting is that with the confidence bands reported in the mortality curves, anything that exceeds these bands should already be significant from a statistical point of view. If vaccination precedes such mortality anomalies, they would trivially be attributed causality. One case in point is the mortality curve of Norway, which never exceeds the confidence bands before vaccination starts but spikes beyond this band and follows the vaccination curve by a 11-week delay (Figure 3). This clear temporality would be difficult to attribute anything other than vaccination. The Norwegian Health Institute notes the anomalous mortality at the end of 2021 but speculates that it is due to covid deaths, avoiding this large warning signal with regards to vaccination (FHI (2022)).
Consistency: In light of the large variability of adverse effects across batches, expecting consistency across countries might not be realistic. Nevertheless, most countries do show an effect even though the effect is varied in strength and sometimes in timing. Israel is perhaps the most striking example of a consistent spike in mortality followed by vaccination doses, where even smaller features in vaccination rates are mirrored in mortality (see Appendix).
Methodology
We obtain mortality data from the Short-term Mortality Fluctuations (STMF) data series maintained by the Human Mortality Database, while the vaccination data is obtained from the Our World In Data Covid-19 dataset available to the public as a csv file.
The mortality data is first converted to mortality rates for each age bracket where population is linearly interpolated from each end-of-year tally. The rates are then smoothed with a windowed average of 3 weeks with twice the weight on the middle week compared to the edge weeks. This reduces the missing values to 1% which is filled in with nearest preceding neighbors. Rates are then converted to numbers of deaths through the European Standard Population which normalizes to a population of 100k.
We then estimate annual trends using a reasonably smooth polynomial (with 2 degrees of freedom). Weekly trends are similarly estimated with periodic polynomials. The estimation procedure we chose was quantile regression, where the estimate is the median while the confidence interval is the 95th confidence band (R. Koenker, 2022). We chose this due the its robustness and ability to be stable in light of outliers. The fit uses only data before 2020 as this was before the covid outbreak, which is the period to which we compare the post-2020 era. Thus, the annual trend is assumed constant after 2020, and the weekly trend estimation excludes all data post 2020.
Vaccine numbers are end-of-week tallies (ISO weeks). Because vaccination is not reported by age bracket, we omit mortality numbers in the 0-15 year age bracket for accuracy of comparison.
The smoothing parameters for the annual and weekly smoothing was cross-validated by fitting the model on all-but-one year sequentially holding out one year at the time in the 2013-2020 data set. We find that the estimated 95% confidence interval has an out-of-sample adjustment to between 80-100% depending on country (plots not shown). This means that the confidence intervals are reasonably accurate in the out-of-sample data. Similarly, the confidence interval is chosen to be a constant offset from the trendline as adding any more complexity (in the form of a polynomial) reduces the out-of-sample exceedence probability (plots not shown).
Appendix - All countries
Data and Code availability
The mortality data is downloadable here, and the vaccination data is available here. See Methodology for more details on sources.
All code to calculate age-standardized and de-trended excess mortality is available in this notebook and the vaccination pre-processing and plotting is available in this notebook.


